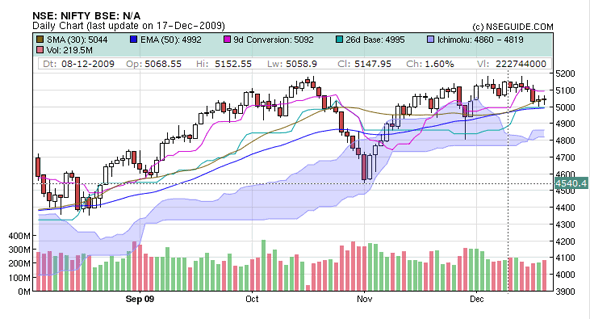
Yes, this is most common question a normal trader would ask, i.e why there is actually a need to use Technical Charts?
In-fact, I too had the same question in mind when I started just started to trade. Well, Technical charts are very useful to any trader who seeks to understand how a stock reacts to previous trends and well as helps him to foresee future events for a stock.
Imagine, if you wanted to look at the price of a script say 4-5 months ago, yes, you could get the data in a tabular form, but it would be very confusing, as searching for a particular date would be very difficult, on the other had, consider a CandleStick Technical chart, using a chart you could easily browse the stock open, high, low & close rates for a rage of dates. This would also help you know the trend of a particular stock.
Moreover, Technical charts with various Indicators such as RSI, Ichimoku clould and DMA’s can help you predict where a stock is likely to go in the next couple of days and even weeks. Technical charts are also used to predict the entry and exit levels of a asset.
Technicians say that a market’s price reflects all relevant information, so their analysis looks more at “internals” than at “externals” such as news events. Price action also tends to repeat itself because investors collectively tend toward patterned behavior – hence technicians’ focus on identifiable trends and conditions.
Technical analysis is frequently contrasted with fundamental analysis, the study of economic factors that influence prices in financial markets. Technical analysis holds that prices already reflect all such influences before investors are aware of them, hence the study of price action alone. Some traders use technical or fundamental analysis exclusively, while others use both types to make trading decisions.
Users of technical analysis are most often called technicians or market technicians. Some prefer the term technical market analyst or simply market analyst. An older term, chartist, is sometimes used, but as the discipline has expanded and modernized the use of the term chartist has become rare.
Types of Charts
OHLC - Open High Low Close charts plot the high and low of the price movement vertically and the open and close horizontally. Used to graph range and outliers.
Candlestick chart - Similar to OHLC, but open and close are filled. Often Black or Red candles represent a close lower than the open. While White, Green or Blue candles represent a close higher than the open.
Line chart - Connects each closing interval together on a line
OHLC - Open High Low Close charts plot the high and low of the price movement vertically and the open and close horizontally. Used to graph range and outliers.
Candlestick chart - Similar to OHLC, but open and close are filled. Often Black or Red candles represent a close lower than the open. While White, Green or Blue candles represent a close higher than the open.
Line chart - Connects each closing interval together on a line
Over the past several decades Technical Analysis with quality charts, have proven and given traders more returns on their Investment.
Any Queries? Comment below, We respond ASAP :) ty