Showing posts with label technical analysis. Show all posts

Monday, November 25, 2013

What is Resistance ?

Resistance can be defined as a level from which a stock tends to go down. Its a level which indicates that the stock is likely to witness some profit booking, and some downside is possible in the next coming days.
Its is an awareness of patterns associated with resistance zones (areas usually associated with previous trading ranges, in which prices find resistance against further upside) enables investors to more accurately define the direction of significant market trends. S
Identifying the Resistance level of stock is merely done by looking at the last 3-4 high’s of the stock from which it declined, but it takes some practice and is somewhat subjective because there are points that can be considered weak support or resistance and strong support or resistance. Resistance are areas where prices tend to consolidate and reverse. Resistance provides resistance to prices that are shooting pu.
Determining the strength of the Resistance levels also plays an important role, this is done by counting how many times did the stock price declined prices from shooting up further, in other words counting the number of times the stock declined from its support levels, The more times it declined, the stronger and more significant the Resistance point.
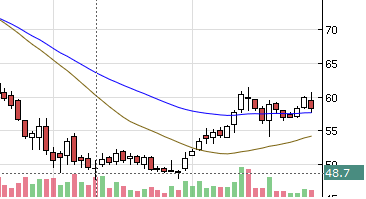
As seen in the left hand side chart, it shows the resistance level of Idea, it faces strong resistance around 62 levels, it manged to touch that level nearly 2-3 times, in a series.
But, once a stock successfully crosses its resistance, some more upside can be seen in the stock.
Any Queries? Comment below, We respond ASAP :) ty

What is Support ?

Support can be defined as a level from which a stock tends to bounce back. Its a level which indicates that the stock is likely to witness some fresh buying, and some upside is possible in the next coming days. Its is an awareness of patterns associated with support zones (areas usually associated with previous trading ranges, in which prices find support against further decline) enables investors to more accurately define the direction of significant market trends. Such patterns also suggest areas in which price reversals are likely to take place.
Stock never advance in a straight line, they tend to go up in a series of advance’s, flat or retracement period, further advance, another flat or retracement period, and so forth.
Identifying the support level of stock is merely done by looking at the last 3-4 low’s of the stock from which it bounced back, but it takes some practice and is somewhat subjective because there are points that can be considered weak support or resistance and strong support or resistance. Supports are areas where prices tend to consolidate and reverse. Support provides support to prices that are declining.
Determining the strength of the Support levels also plays an important, this is done by counting how many times did the stock price hold prices from dipping further, in other words counting the number of times the stock bounced back from its support levels, The more times it appreciated, the stronger and more significant the support point.
As seen in the left hand side chart, it shows the support level of Idea, it faced strong support around 48 levels, it manged to touch that level nearly 4-5 times, in a series.
Once it made a close above 49-50, it made a high of 62, this indicates the importance of a support levels, but if the stock would have gone below is support level of 48, it could easily see 35 levels. A trader should only make a buy decision once he witnesses some buying interest in the stock.
Any Queries? Comment below, We respond ASAP :) ty

Saturday, November 23, 2013

Why Technical Charts & Technical analysis ?


Yes, this is most common question a normal trader would ask, i.e why there is actually a need to use Technical Charts?
In-fact, I too had the same question in mind when I started just started to trade. Well, Technical charts are very useful to any trader who seeks to understand how a stock reacts to previous trends and well as helps him to foresee future events for a stock.
Imagine, if you wanted to look at the price of a script say 4-5 months ago, yes, you could get the data in a tabular form, but it would be very confusing, as searching for a particular date would be very difficult, on the other had, consider a CandleStick Technical chart, using a chart you could easily browse the stock open, high, low & close rates for a rage of dates. This would also help you know the trend of a particular stock.
Moreover, Technical charts with various Indicators such as RSI, Ichimoku clould and DMA’s can help you predict where a stock is likely to go in the next couple of days and even weeks. Technical charts are also used to predict the entry and exit levels of a asset.
Technicians say that a market’s price reflects all relevant information, so their analysis looks more at “internals” than at “externals” such as news events. Price action also tends to repeat itself because investors collectively tend toward patterned behavior – hence technicians’ focus on identifiable trends and conditions.
Technical analysis is frequently contrasted with fundamental analysis, the study of economic factors that influence prices in financial markets. Technical analysis holds that prices already reflect all such influences before investors are aware of them, hence the study of price action alone. Some traders use technical or fundamental analysis exclusively, while others use both types to make trading decisions.
Users of technical analysis are most often called technicians or market technicians. Some prefer the term technical market analyst or simply market analyst. An older term, chartist, is sometimes used, but as the discipline has expanded and modernized the use of the term chartist has become rare.
Types of Charts
OHLC - Open High Low Close charts plot the high and low of the price movement vertically and the open and close horizontally. Used to graph range and outliers.
Candlestick chart - Similar to OHLC, but open and close are filled. Often Black or Red candles represent a close lower than the open. While White, Green or Blue candles represent a close higher than the open.
Line chart - Connects each closing interval together on a line
Over the past several decades Technical Analysis with quality charts, have proven and given traders more returns on their Investment.
Any Queries? Comment below, We respond ASAP :) ty

What is Technical Analysis ?

Technical Analysis can be defied as the study of market activities and action, mainly using charts for the purpose of forecasting or predicating the future price trends. Here “market activities” refer to the changes in the price and volume of stock.
Technical analysis is mainly used by Trades (i.e people of often buy and sell stocks for Intraday or Swing basis) and not for Investors(i.e people how invest in a company for 3-5 years) to identify what is the next trend that the stock is going to make. It can be tough of a torch that guides a Trader to make profits in dark.
Over the time there have been many types of Technical charts have been developed, the main contributors to Technical analysis have been the Japanese, their major invention was the Candlestick Charts that are mostly used now-days by almost all Traders and Technical Analyst.
Technical Analysis supposes markets have memory. If so, past prices, or the current price momentum, can give an idea of the future price evolution. Technical Analysis is a tool to detect if a trend (and thus the investor’s behavior) will persist or break. It gives some results but can be deceptive as it relies mostly on graphic signals that are often intertwined, unclear or belated. It might become a source of representativeness heuristic (spotting patterns where there are none)
Chart formations tell stories which only technical analysts could read. Examples are double top formations which signal a potential decline in the price of the particular stock. Double bottom is the opposite signal illustrating a stock ready to advance in price. Technical analysts use such chart formations to enter or exit their positions.
Technical analysis is a form of analysis which seeks to make judgments about the performance of a share based solely on its historic and current price behavior and without reference to the underlying business, the sector the company’s in, or the economy as a whole.
There are many instances of investors successfully trading a security using only their knowledge of the security’s chart, without even understanding what the company does. However, although technical analysis is a terrific tool, most agree it is much more effective when used in combination with fundamental analysis.
After the end of this Pathshala you shall be familiar with all the techniques used by various Technical experts to understand charts.
Any Queries? Comment below, We respond ASAP :) ty